TM-30-15 TESTED
HIGH FIDELITY AND FULL COLOR GAMUT BY YUJI LED
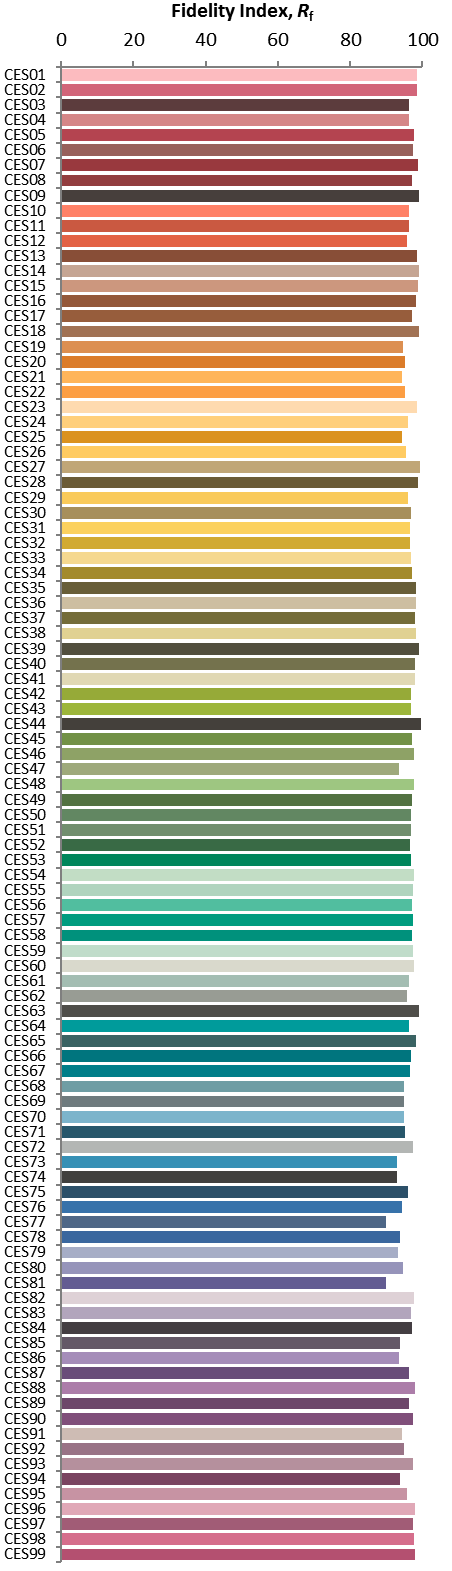
HIGH FIDELITY INDEX Rf UNDER THE TM-30-15 METRIC
TM-30-15 is a new and improved IES method for characterizing the color rendering ability of white light sources. While CRI and extended CRI utilize 8 and 15 color samples, respectively, they do not necessarily represent the actual colors that we would encounter in the real world. The new fidelity index (Rf) developed under TM-30-15, on the other hand, utilizes 99 color samples in its calculation, providing a much more statistically representative and reliable metric in describing a light source’s ability to faithfully render colors. In line with CRI, the best possible score for Rf under the TM-30-15 rubric is 100.
TM-30-15 Fidelity Index (Rf): 99 color samples
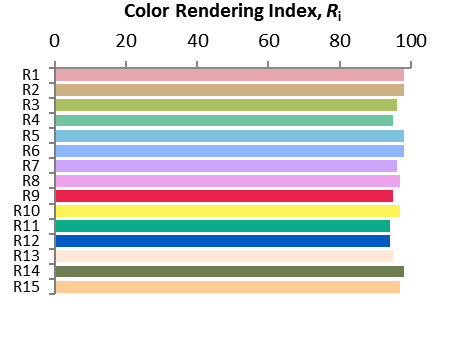
Color Rendering Index (CRI): 8 or 15 color samples
UNDERSTANDING THE FIDELITY INDEX (Rf) AS PER TM-30-15
Rf under TM-30-15 has been developed with the general public’s prior acceptance of CRI as a color rendering metric in mind. As such, the conceptual application and mathematical scaling remain very similar to CRI. Our testing and calculations show that our CRI Ra and TM-30-15 Rf values correlate very strongly, although this may not be the case with all LEDs, particularly those that utilize filters or supplemental LEDs to specifically target CRI increases. Our ability to achieve high Rf scores is a testament to our expertise in phosphor recipe development and design of SPDs based on fundamental Planckian black body curves.
One significant advantage of Rf under TM-30-15 is the availability of 99 color samples whose chormaticities have been chosen from real-world objects, and furthermore, have been categorized as those occurring in either 1) nature, 2) skin, 3) textiles, 4) paints, 5) plastics, 6) printed material and 7) color systems. This means that specifying and characterizing LEDs can now be application-specific, with comparison across LEDs with respect to rendering particular color types made possible.
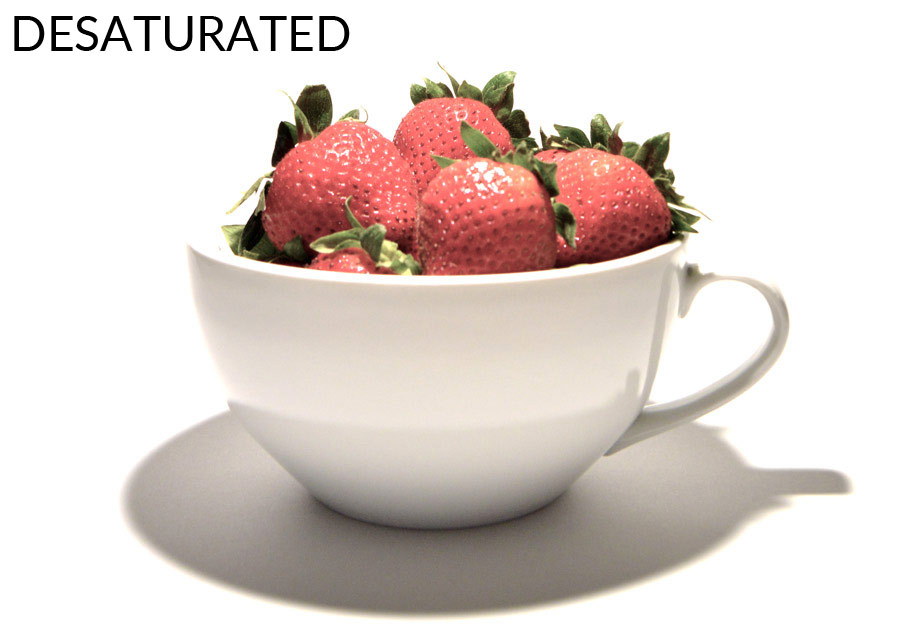
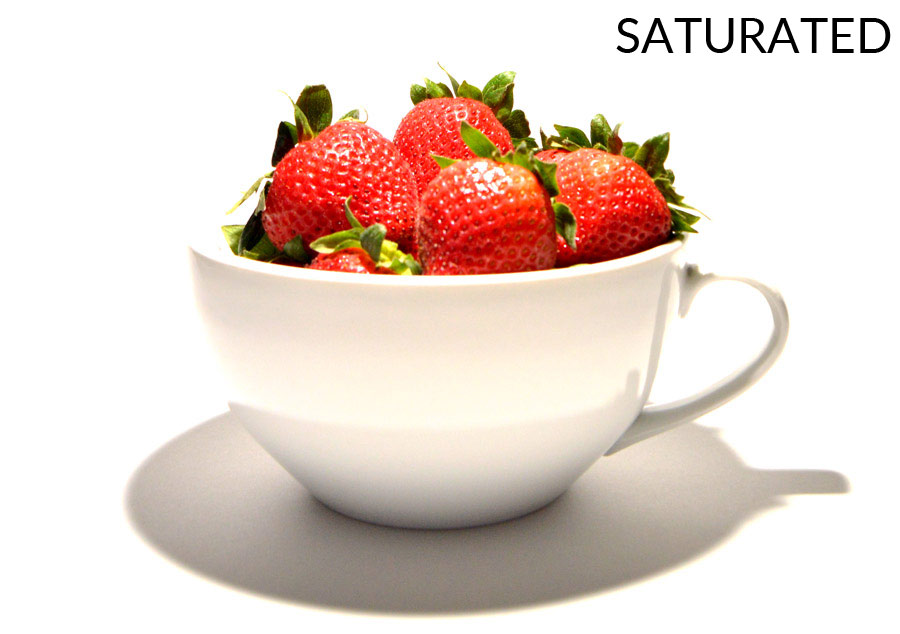
FULL COLOR GAMUT
VIVID AND ACCURATE
FULL COLOR GAMUT (Rg) AS PER TM-30-15
In addition to an improved color fidelity metric, the TM-30-15 method introduces an additional dimension to color quality through the gamut index (Rg). The Rg gamut index provides information about the relative range of colors that can be produced (via reflection) by a white light source. A score close to 100 indicates that, on average, the light source reproduces colors with similar levels of saturation as an incandescent bulb (2700K) or daylight (5600K/6500K). For LEDs of decent color quality, Rg can typically range between 80 and 120, with higher scores representing higher overall levels of saturation.
TM-30-15 color vector graphics
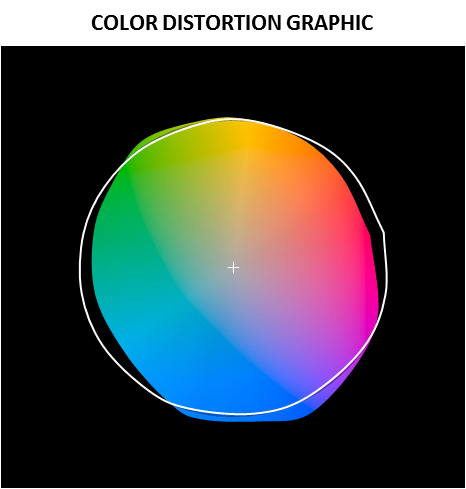
A competitor Rg = 98 LED using a standard blue pump (CRI = 83, Rf = 81). Sample SPD 194. This LED oversaturates blue, violet and green/yellow, while under-saturating reds and cyan colors. Despite the various distortions, the overall Rg score “averages out” to 98.
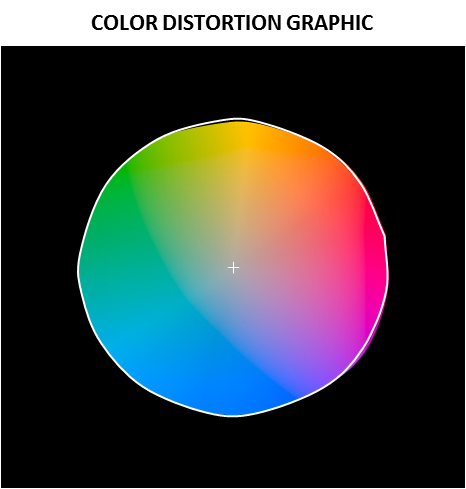
Yuji LED with Rg = 99 using a violet pump (CRI = 98, Rf = 97). This LED provides even saturation levels for all colors.
INTERPRETING TM-30-15 COLOR VECTOR GRAPHICS
The TM-30-15 color vector graphics are very intuitive and informative tools in informing us about a color source’s tendencies to reveal certain colors as appearing more vivid while others dull. For applications such as task lighting where color accuracy is required, a smooth, evenly distributed vector chart would be desired. On the other hand, for certain applications such as retail, over-saturation in certain colors may even be preferred in order to increase its vividness. Yuji LED has a wide range of phosphors that allow for manufacture of LEDs with customized SPDs that can increase saturation in particular color.
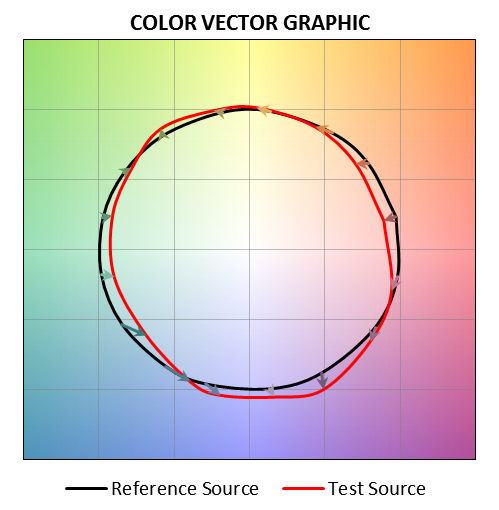
An Rg = 98 LED using a standard blue pump (CRI = 83, Rf = 81). The vector graphic shows color areas and directions in which there is a deviation from a reference source.
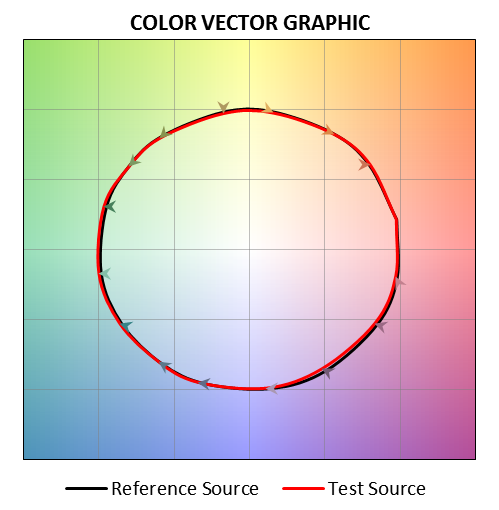
Yuji LED with Rg = 99 using a violet pump (CRI = 98, Rf = 97). The strong overlap between the test source and reference source shows that the saturation and gamut levels of the Yuji LED come very close to natural or incandescent light sources.